Installation and Setup
Installation and Test Run Instructions (Windows)
The following installation and test run instructions are for Windows users of EnergyPATHWAYS. Mac use is possible but involves a different setup and use of EP through the command prompt (as opposed to macro functions in the scenariobuilder.xlsm). See https://energypathways.readthedocs.io/en/latest/interface.html#run-energy-pathways-on-macos for more information.
For a more detailed description and walkthrough of the EP Interface, please take advantage of the videos posted on https://energypathways.readthedocs.io/en/latest/interface.html.
Install the EnergyPathways Model
Navigate to https://energypathways.readthedocs.io/en/latest/setup.html. Follow the main installation steps on the page (summarized in steps b-g below).
Download the Anaconda (or miniconda) Distribution linked on the page.
Clone the GitHub files.
Download the GitHub desktop app.
Clone https://github.com/EvolvedEnergyResearch/EnergyPATHWAYS
Note: It is not recommended to download the .zip file and extract EP from there. It was unsuccessful for the group. Cloning was successful.
Open the Anaconda Prompt app (found in Windows Search; may have to run as administrator).
Change directory to the folder containing “environment.yml” using the “cd” command. For example, if the GitHub files were cloned into Documents, type:
$ cd C:\\Users\\Username\\Documents\\GitHub\\EnergyPATHWAYS
Proceed with commands listed on website site (copied below):
$ cd EnergyPATHWAYS
$ conda env create -f environment.yml
$ conda activate ep
$ pip install -e .
EnergyPathways is now installed.
Setup Interface
Go to the location where EnergyPATHWAYS is installed (where it was cloned to from GitHub). Copy the interface folder (EP interface) from the EP main folder to a new working directory (to keep the original copy preserved).
Open scenario_builder.xlsm from copied EP interface folder.
Open xlwings.config tab of sheet. Ensure the following three lines match:
Interpreter_Win: python
Conda Path: C:\Users\Username\anaconda3 (Note: This may be different depending on where anaconda3 is installed. See website for how to find folder location.)
Conda Env: ep
Retrieve and Prepare Test Database
Download the Australia test database from Dropbox.
Reference: Davis, Dominic, Andrew C. Pascale, Bishal Bharadaj, Richard Bolt, Michael Brear, Brendan Cullen, Robin Batterham, et al. Net Zero Australia - Slide Pack and Input Data (Updated Version). Data Collection. The University of Queensland, 2024. https://doi.org/10.48610/e32f6e5.
Put both folders (database and model_runs) into the new working directory (where the EP Interface copy from step h.i is).
Open the model_runs folder. In test_scenario, open config.INI. Edit the fourth line to include the directory of the database folder.
Example: database_path = C:\Users\Username\Documents\GitHub\database
Open the scenario_builder.xlsm sheet again.
In the yellow box on the top left of both the cases and controls tab, put the model_runs folder directory.
In the cases tab, under the “database” section, add the directory of the database folder to cell L6. (step may be unnecessary due to database directory specification in config.ini)
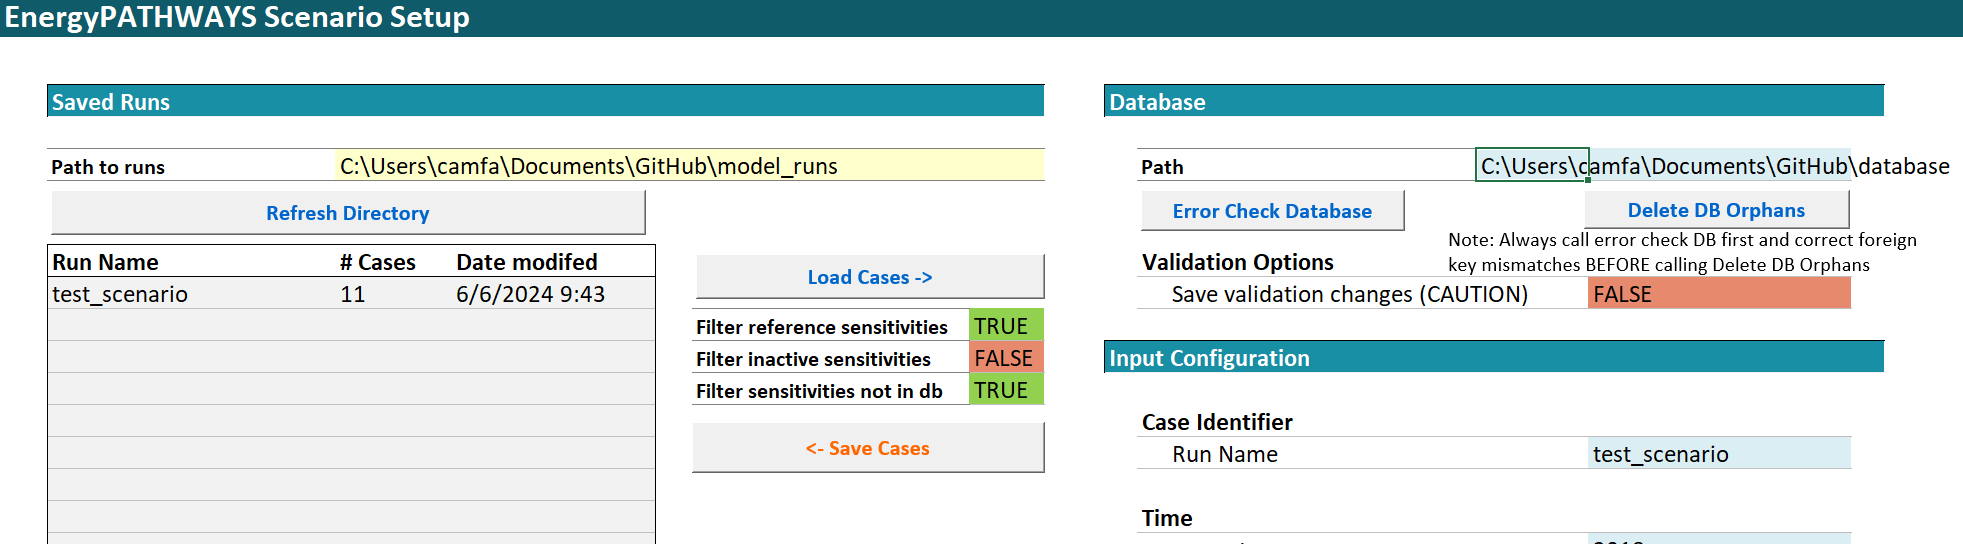
Scenario builder cases tab. The yellow cell in the top left illustrates the cases tab change made in Step E. Make an identical change to the yellow cell in the controls tab.
Disable RIO Export Process
To avoid an edge case that may crash the program, disable the RIO export component of the code (this will also speed things up). Note that this is a temporary fix since the long-term goal for EP is to replace the RIO model export component with MACRO supply side model export capabilities. Make the fix by opening the file pathways_model.py and commenting out the following two lines of code:
Line 57: #export = ep2rio.RioExport(self)
Line 58: #export.write_all()
Load Cases into Model and Run
In the cases tab, select “Refresh Directory” and let test_scenario appear in the run list (should have 11 cases). Then click on the test_scenario cell in the list and press “Load Cases” and let the data cells on the right-hand side of the sheet populate.
Next, go the controls tab and select “Refresh.” In a similar fashion to before, test_scenario should appear in the list. Click on it again and select “Queue Selected Scenario.”
Now, the different cases should appear in the “Case List.” Remove any that you do not want to run.
Note: You might just want to run one case (e.g., reference) at first to make sure it can go through without error.
Adjust the number of cores and command windows in the “Cases run controls” section to control performance. Then click “Start Runs.” This may take several hours.
Visualize Data
At the conclusion of the run, select “Compile Finished Cases” to aggregate data and make it easier to examine.
Download Tableau if you do not already have it and open one of the .csv files from the aggregated output folder (folder name: _aggregate_ouputs_EP).
Example: To look at energy, open d_energy.csv in Tableau. Can use area chart with a setup like that in Figure below to visualize by sector or energy type.
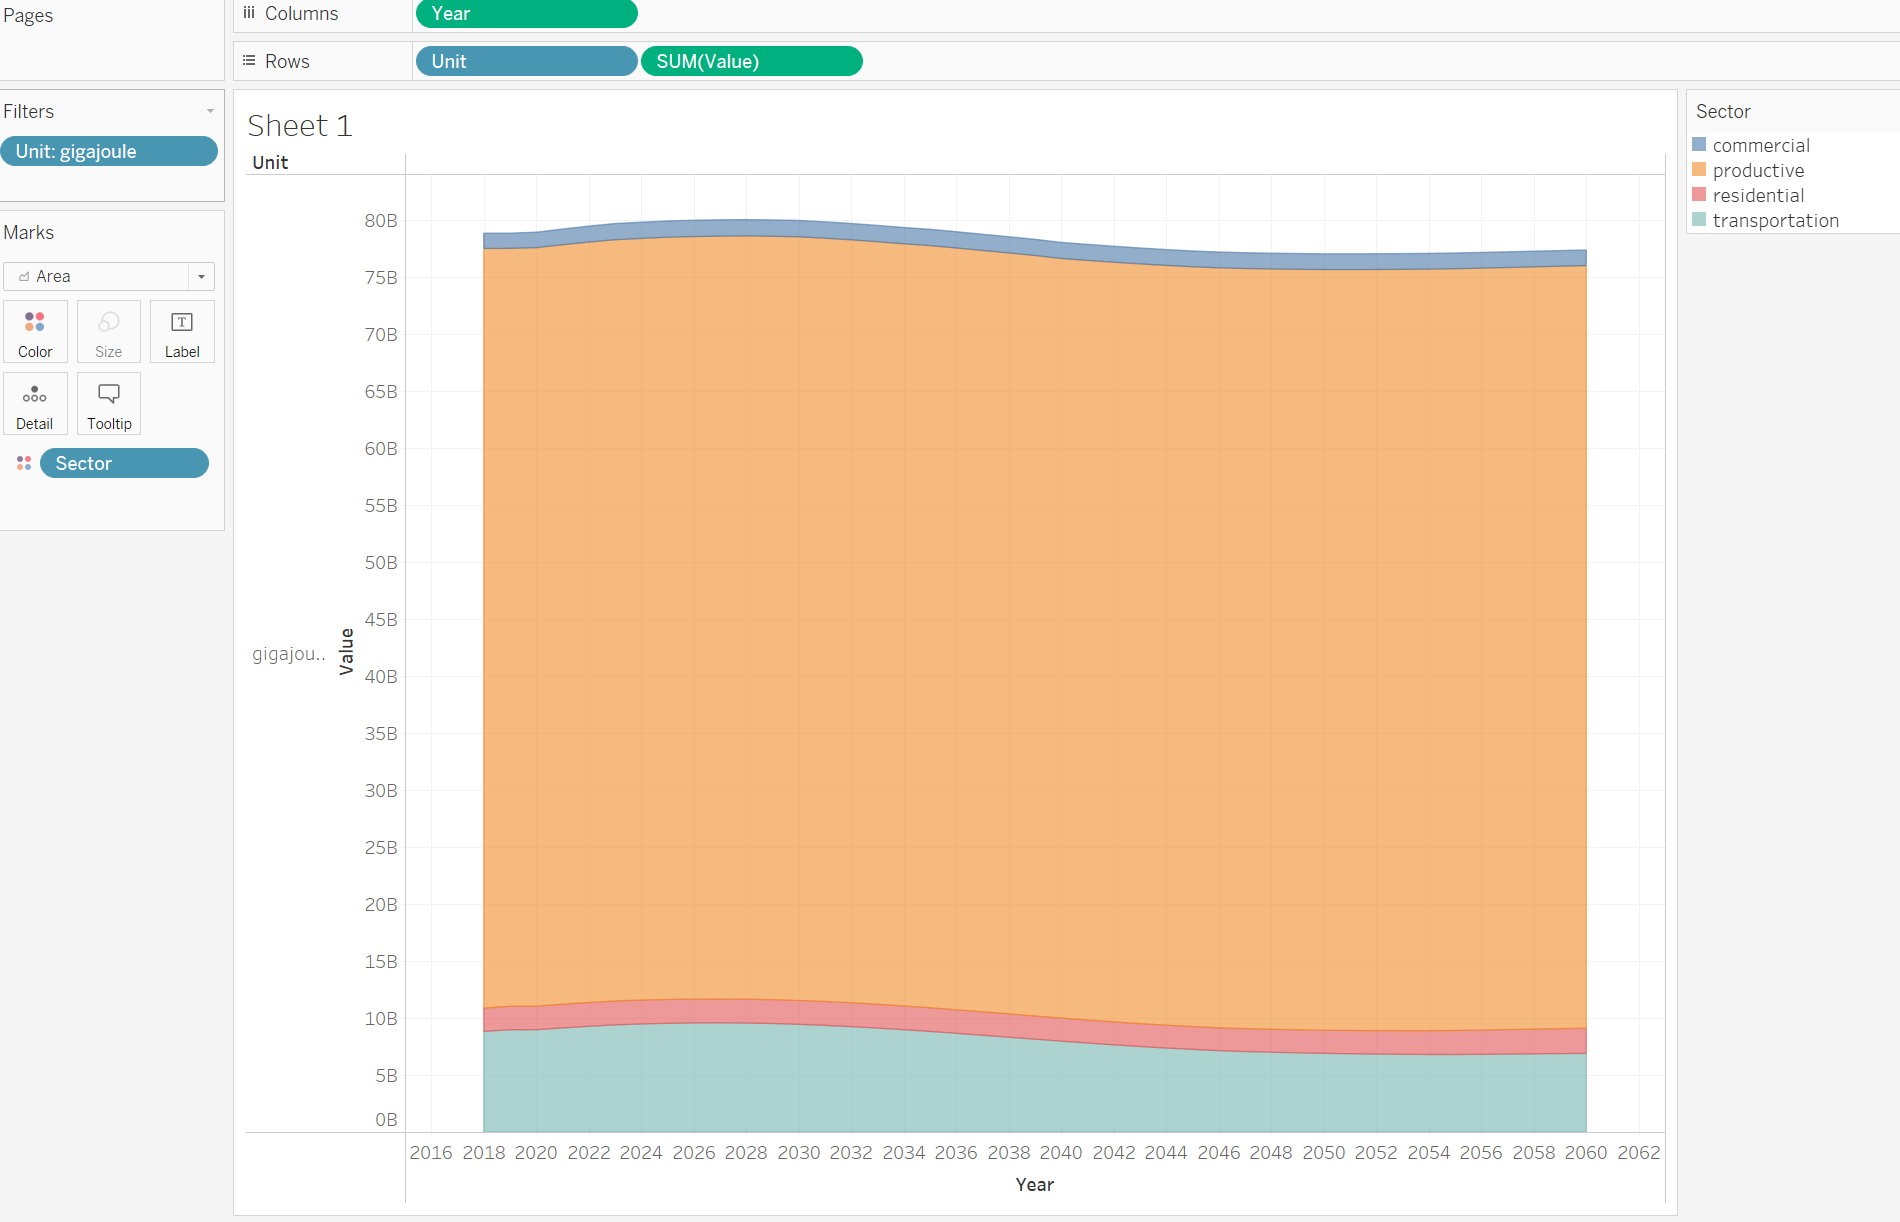
Results for energy demand in the test database reference case, color coded by sector in Tableau.